How to Ruin Thanksgiving with Robots!

Hello all!

It all started the night before Thanksgiving.  It was 11:58 PM, and I was up late doing pretty much nothing when I had an idea… “What if I build a robot to pass food around the table?” So I stayed up all night long to build it, which in reality took me around 2 total hours, and the other 8 were spent dozing in and out because staying up was a terrible idea like this entire thing was.

The plan was simple: use 2 motors with 3D printed brackets, a paper plate, an Arduino Nano, and an ultrasonic sensor to make a robot that moves around the table.  When the robots distance to an object in front of it is greater than 5 centimeters, but less than 150 centimeters, it will move forwards until it is less than 5, at which point it will stop moving and wait 30 seconds before turning.  If the distance is greater than 150 cm it will also turn, as this generally assumes that it has reached the edge of the table and it may fall, so it will turn away from it.

Arduino is written in C++, so there are 2 main functions in the code, as well as the ability to declare global variables outside of these functions.  We will begin by declaring variables that hold the values for which pins we want to use as our motor outputs, our ultrasonic sensor input and output, include the ultrasonic sensor library, and instantiate the ultrasonic sensor.

#include <HCSR04.h>
int triggerPin = 6;
int echoPin = 7;
#define m1low 2
#define m1high 3
#define m2low 4
#define m2high 5

UltraSonicDistanceSensor distanceSensor(triggerPin, echoPin);

// M1 is motor 1, which is on the left side
// M2 is motor 2, which is on the right side

The next function is called the setup function, which is generally used to instantiate classes and setup things like serial monitors.  In our case, we are using it to assign the pinModes for our different input and output pins, as well as set up a serial connection for the ultrasonic sensor.

void setup() {
  Serial.begin(9600); 
  pinMode(m1low, OUTPUT);
  pinMode(m1high, OUTPUT);
  pinMode(m2low, OUTPUT);
  pinMode(m2high, OUTPUT);
}

After we’ve setup all of our pins to be used, we setup a few different loops to determine the distance between the robot and the nearest object.  As described above, if this distance is greater than 150cm then the robot will turn, if it is between 150cm and 5cm it will go straight forwards, and if it is less than 5 it will turn.  We can grab the distance using the .measureDistanceCm(); method from ultrasonic sensor library.

void loop() {
  double distance = distanceSensor.measureDistanceCm();
  Serial.println(distance);
  while(distance >= 150){
    digitalWrite(m1high, HIGH);
    digitalWrite(m2low, HIGH);
    digitalWrite(m1low, LOW);
    digitalWrite(m2high, LOW);
    distance = distanceSensor.measureDistanceCm();
  }
  if(distance >= 5 && distance < 150){
    digitalWrite(m1low, LOW);
    digitalWrite(m2low, LOW);
    digitalWrite(m1high, HIGH);
    digitalWrite(m2high, HIGH);
    delay(500);
  }
  if(distance <= 5){
   digitalWrite(m1high, HIGH);
   digitalWrite(m2low, HIGH);
   digitalWrite(m1low, LOW);
   digitalWrite(m2high, LOW);
   delay(30000);
   digitalWrite(m1low, LOW);
   digitalWrite(m2low, LOW);    
   digitalWrite(m1high, LOW);
   digitalWrite(m2high, LOW);
  }
}

And like that we have finished the code!  Now onto the physical build.  I started by designing a bracket for the motors I had, this bracket is up on my Thingiverse and in the GitHub repo for this project.  I originally planned to screw these into a circle of wood (hence the holes for screws) but never ended up doing this and instead hot glued it to a paper plate.  Next up I pulled out a breadboard and an Arduino nano.  I wired pins 2 and 3 to the first motor, with a 1K ohm resistor on pin 2 so I could have a fast and high speed.  I did this the same for pins 4 and 5 for the second motor.  Then I placed pins 6 and 7 as the trigger and echo for the ultrasonic sensor.  I finished up the electronics by using a spare 9 volt to 5 volt board I had to power the Arduino, and duck taping it all very nicely to the bottom of the plate.  Here are some photos from the process:

ThanksgivingBotGuts
The breadboard and wires from the robot.
ThanksgivingBotDone
The finished bot. Worked better upside down than right side up!

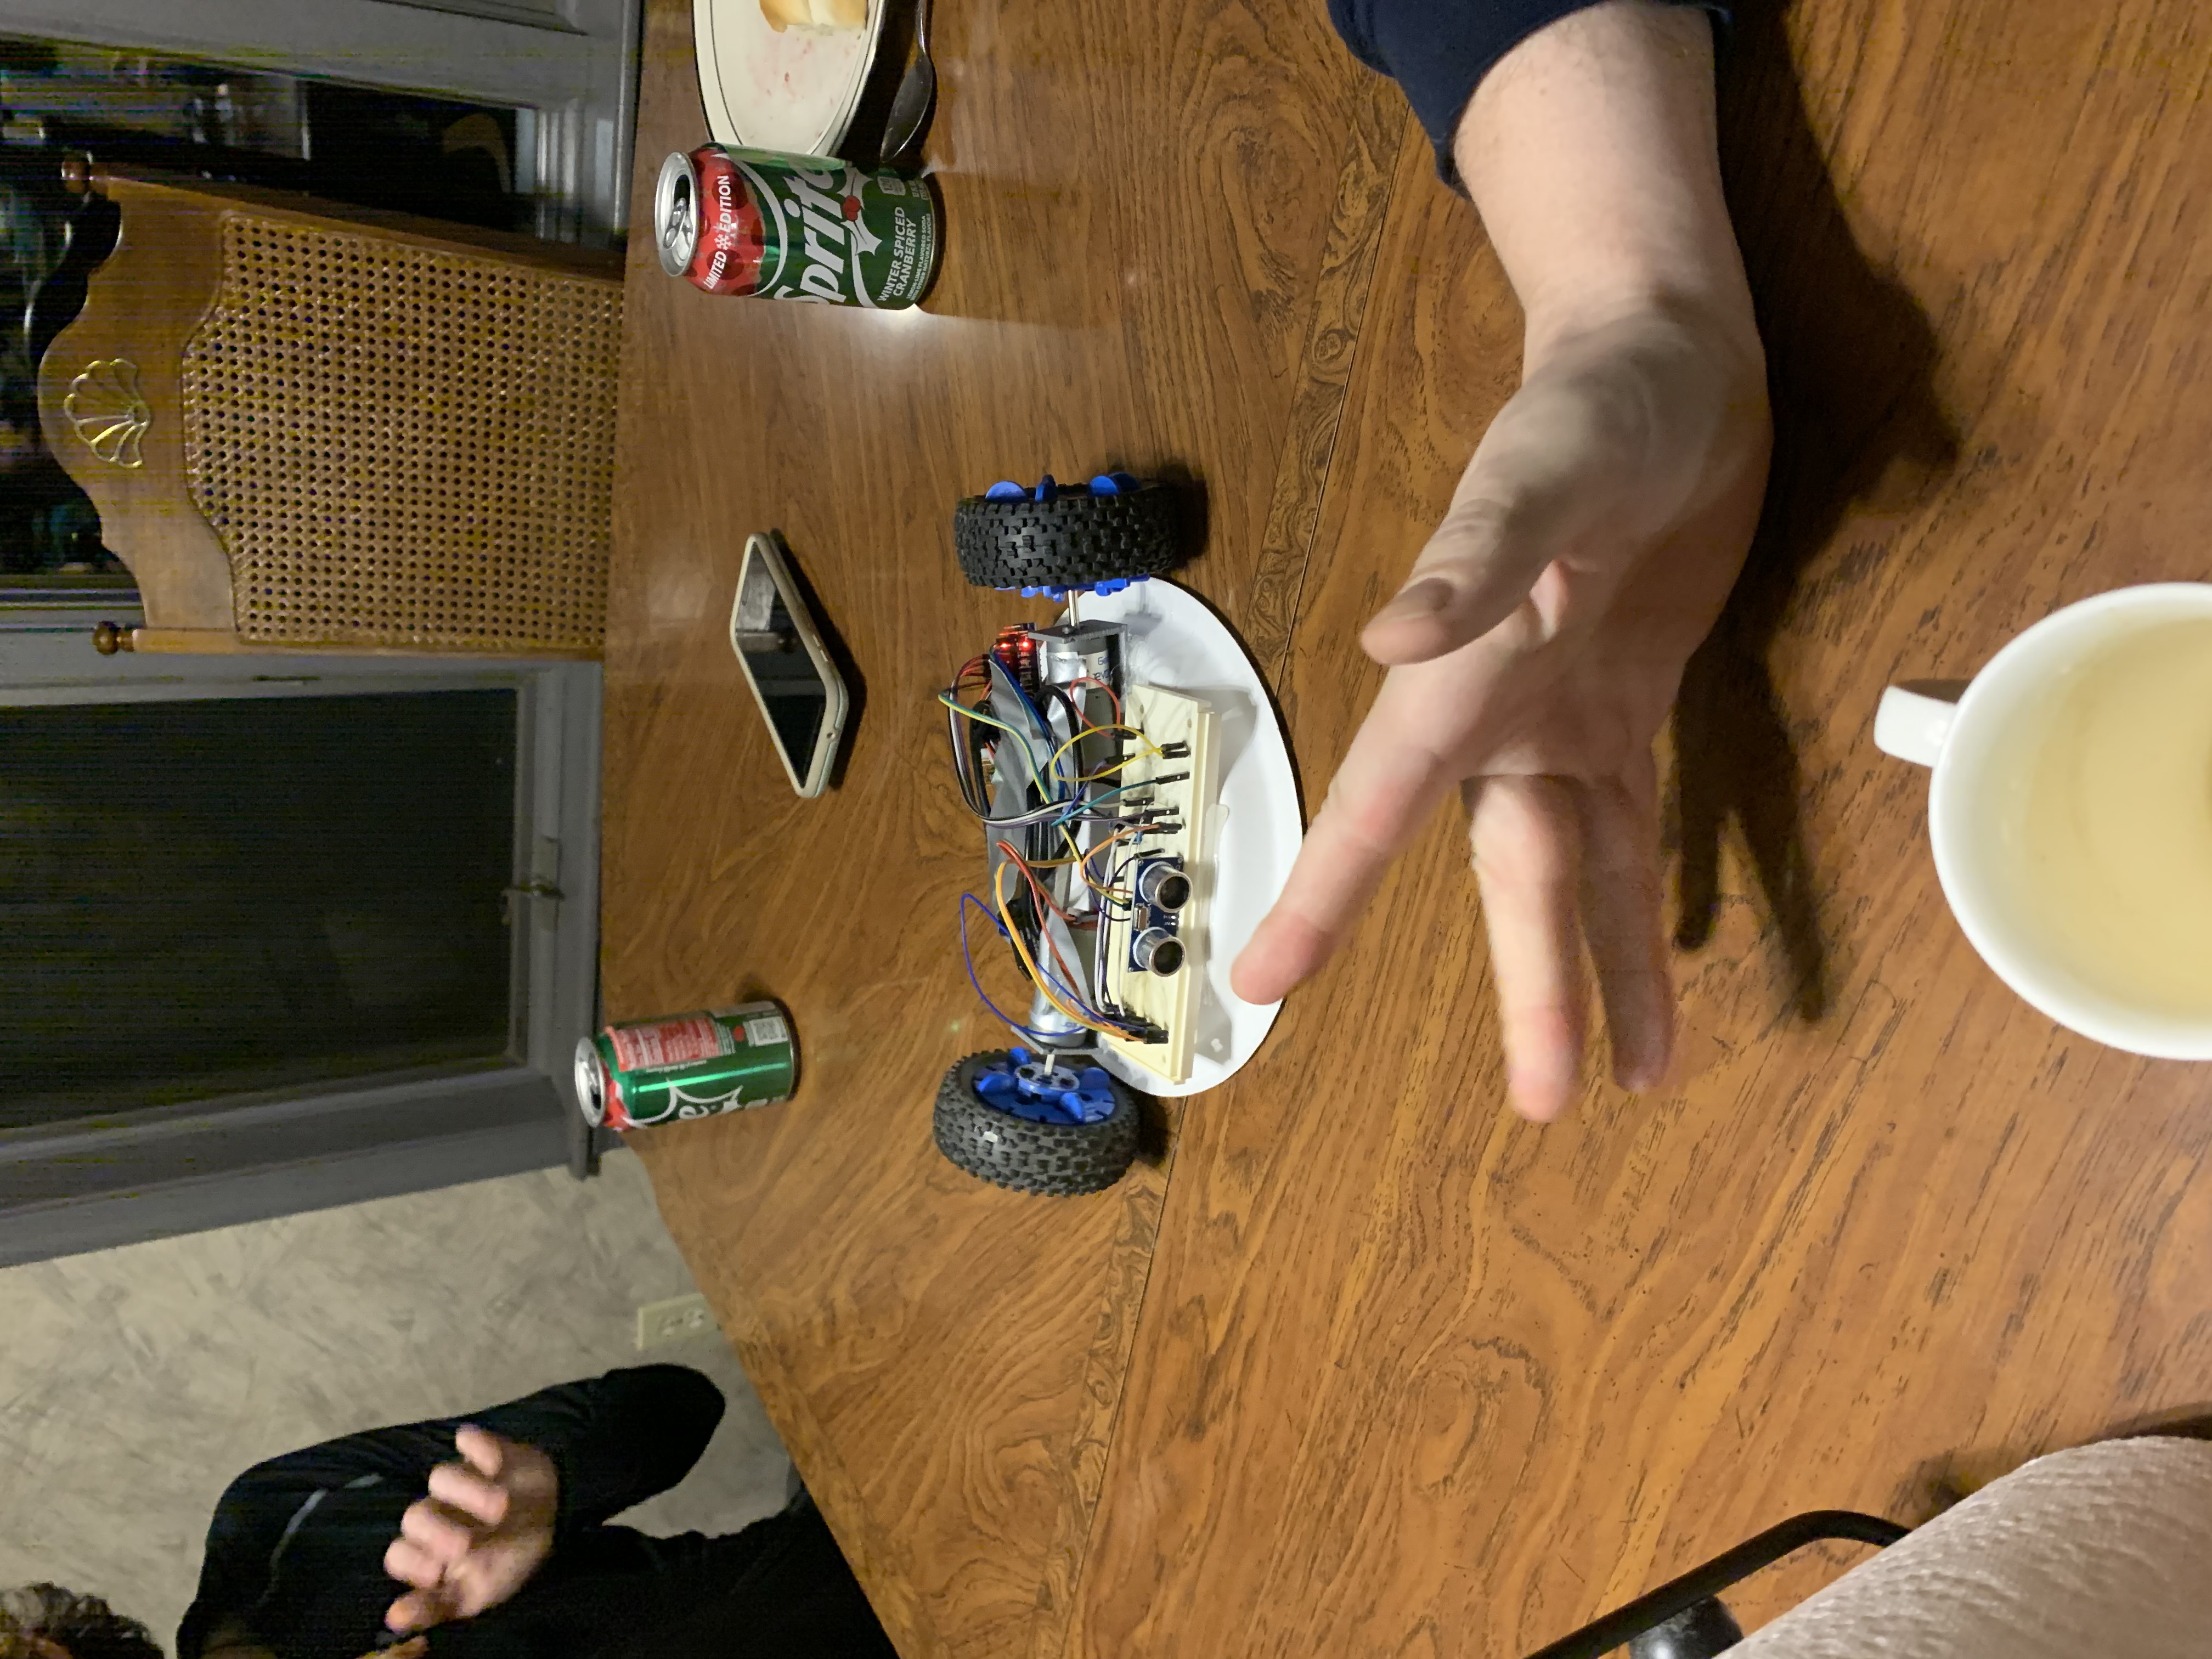
Overall the robot was a ‘success’ in the sense that it was just as terrible as I expected it to be.  The reaction from my family members was hilarious as I pulled the robot out and placed it on the table, seeing the confusion and impending doom as I turned it on and it inched forwards before dropping a piece of pie onto the table.  It was also amazingly hilarious that the robot worked better upside down than the way it was originally designed to work in.

Thanks for reading and have a wonderful day!
~ Corbin

Carry Counts

Hello all!

It’s been a while since I’ve been able to post, but I wanted to cover another Bloomsburg problem from 2018 for my programming club.  The problem description is this:

When calculating the sum of two numbers by hand, we first add the digits in the 1’s position, and if the result overflows (i.e., is greater than 9) then we carry the leftmost 1 in the result to the 10’s position. This process is repeated at the 10’s position, then at the 100’s position, and so on. For example, if we are calculating 1523 + 817 by hand, we write:

In this case, there are two carries (shown in circles).

Write a program that prompts the user for two positive integers and outputs the number of carries that would occur when performing addition by hand.

The following test cases illustrate the required I/O format.

We’ll begin this problem by defining our variables and taking in some input.  Our input will be the two integers we will be adding, and then we will be putting them into a list.

carries = 0
int1 = int(raw_input("Enter two positive integers to be added: "))
int2 = int(raw_input())
ints = [int1, int2]

Next up we need to define our algorithm we will be using.   For this problem we will be using a new function called zfill(). The zfill() function fills a string up with zeroes on the left side until a specific length is reached.  We’ll also be using the .max() method to find the maximum value of the list, and then run the len() method on it to get the max length.  Doing this we can fill up both integers until they are the same length, allowing me to then work backwords through them, adding each value from right to left and counting the carries for each value.

length = len(max(ints))
add1 = int1.zfill(length)
add2 = int2.zfill(length)

Then we’ll use a for loop to loop through the length of the integers, moving from right to left and adding each value.  If the summed value is greater than 9, then the value will have a carry.  We also need to create a variable called extra, which I will use as the actual carry, because in a case like 89+11 the carry from the ones value causes the tens value to also increase by one, so we must account for it.  Otherwise if the summed value is less than or equal to nine, we do nothing and set extra equal to zero.

for i in range(length):
    if int(add1[-(i+1)]) + int(add2[-(i+1)]) + extra >=10:
        extra = 1
        carries += 1
    elif int(add1[-(i+1)]) + int(add2[-(i+1)]) + extra <= 9:
        extra = 0

After we’ve iterated through the integers, we just need to check how many carries there were and print our statements accordingly for grammatical correctness.

if carries == 1:
    print("There will be 1 carry.")
elif carries <= 0:
    print("There will be no carries.")
else:
    print("There will be ", carries, " carries")

And now we have a working solution to Bloomsburg 2018 Problem 3, Carry Counts.  I hope this helps. 🙂

Thanks for reading and have a wonderful day!
~ Corbin

Spawncamp

Hello all!

This post is a bit off the normal topics I cover here, but I feel it will be helpful in the future for both me and others to reference to.  What I’d like to talk about here is an area that I run at BSides Delaware (And soon some other conferences!) called Spawncamp. Here I want to cover what Spawncamp is, why I feel you should care, and how to create your own for a conference you run or help out at.

Some background, I started going to conferences when I was 6, the first conference I went to was BSides Delaware.  Conferences like these really helped define a lot of my life, and I owe a lot of my passion and learning to the people I’ve met at them.  When my father brought me there, there was no real place set for kids, meaning a lot of what I did was running between different villages like the wireless village and the lockpicking village.  Don’t get me wrong, this was fantastic and helped me a lot because I learned awesome things like lockpicking and SDR hacking at a really young age.  But it wasn’t organized, and it was a lot of work for me to get involved into the community fully, so a few years later I helped ‘spawn’ Spawncamp to alleviate this.

The main goal of spawncamp is to provide a safe place for kids at conferences to learn and enrich themselves in whatever they’re interested in.  It started off with just Computer Science and information security, but I’ve been working to expand topics.  Such as last year (2018) I gave an impromptu class on music theory, and we taught tons of kids and adults chess.  A big thing I’ve noticed from running Spawncamp is that hands on or tangible activities are very attractive to attendees, so topics such as Arduino programming, chess, and 3D Printing hold attention very well.  I always try to keep things interesting and make sure nobody is just sitting there bored with nothing to do, hence my impromptu music theory class in 2018.  In Spawncamp there are 2 tracks, structured and unstructured.  The structured track consists of the main classes and talks that other volunteers and I put on such as a Python class or a Wireshark class.  The unstructured track is where we have activities such as destruction alley, snap circuits kits, or just even legos.  It’s intended to be a place where the kids can hang out and do other activities if there isn’t a class or talk they’re interested in.  So far Spawncamp has improved its content range every year and continues to help kids learn about whatever they’re passionate about.

Why should you care? What if you don’t have kids?  Well adults can learn too! We had some students from the college we are hosted by come into a wireshark talk and they were surprised to have learned a good amount.  And if you do have kids, then hopefully it’s obvious why you should care.  If your kid is interested in a field, then hopefully one of the volunteers will be able to help them either learn more, or maybe explore other fields that the kid is unsure of.  That’s the beauty of Spawncamp, it can be whatever you want!

But, I hear you say, “How do I start a Spawncamp?” Well it’s not that hard, first of course you need a conference or event to host it at, but after you’ve figured that out you can just expand off the base goal into whatever form you want.  I like the form that we’ve come up with at BSides Delaware, which consists of a structured and unstructured track.  In the structured track we place whatever talks and classes we have for that year, they change a lot but a few good ideas are usually Arduino, Python, soldering, 3D Printing, Circuit / Electronics Design.  Then in the unstructured track we have other activities such as destruction alley (where old electronics can be taken apart by the kids and then recycled), chess, potato batteries, and snap circuits.  These activities are hands on and meant to captivate the attention of kids between classes or other activities.

Some pro tips we’ve learned:

      • Use a tarp for destruction alley to prevent damage to floors and losing screws
      • Safety goggles are a MUST HAVE for destruction alley
      • Hands on activities are great, but always have supervision from atleast one other person than the instructor!

I hope this post helps anyone who wants to start a Spawncamp or was interested in determining if it was something they should participate in.

Thanks for reading and have a wonderful day!
~ Corbin

Arduino and RFID Cloning

Hello all!

My summer has been filled with a bunch of projects that I’ll be offloading here soon!  The first one I’ll be talking about is my RFID Cloner I built.  Making the code work took a lot longer than I expected because I haven’t used C++ in around 5 years and Arduino is based off C++, so for some reason, I forgot how to do simple things, but I eventually got it working.  The basis of the project will be the MFRC522 module and an Arduino Mega 2560.  The goal here was to create a system that could scan and duplicate High-Frequency RFID cards.

Before I begin I think it’s necessary to talk about some basic RFID details.  There are 3 main types of RFID; Low-Frequency, High-Frequency, and Ultra-High-Frequency.  These different types determine the radio frequency at which the RFID Card or Tag will ‘excite’ and turn on to let the reader access the information on the card.  Low-Frequency RFID systems operate usually at 125 kHz, which allows them to stand up well against interference, but has the downside of having a low range.  High-Frequency RFID is what the MFRC522 reads and usually operates at 13.56 MHz, which gives it better range but makes it more vulnerable to interference.  And lastly there is Ultra-High-Frequency RFID which operates from 300 MHz to 1 GHz, allowing an insane range up to around 100 meters.  I will be using a passive HF system, meaning that there is no battery powering my card and instead the reader emits an electromagnetic resonance that is used to power the card wirelessly.

Onto the actual project!  My first task was verifying that all my components worked and getting the proper setups for the pieces I was using.  I settled upon 3 libraries that I needed to get everything running smoothly.  The first is SPI.h, which is used for the serial interface to communicate to the MFRC522.  This library was also massively useful for debugging because I could control the MFRC522 directly and monitor what I was doing, allowing me to get the main code working before my display even arrived.  I also used the official MFRC522.h library for controlling the reader and the standard LiquidCrystal.h library for controlling the display.  Importing libraries with Arduino is super easy; if you’re using the standard Arduino IDE just install the library through the library manager and then use the #include <> command.  I also needed to declare the objects so that my components know what pins on the Arduino I’m routing them through, so the beginning of my code looks like this.

#include <SPI.h> // Import Serial Peripheral Interface library for RC522
#include <MFRC522.h> // Import library for RC522 RFID Module
#include <LiquidCrystal.h> // Import library for LCD Display

#define RST_PIN 5 // Reset pin for MFRC522
#define SS_PIN 53 // Serial pin for MFRC522
#define READ_PIN 2 // Pullup resistor pin for read button
#define WRITE_PIN 3 // Pullup resistor pin for write button

MFRC522 mfrc522(SS_PIN, RST_PIN); // Define MFRC522 instance

LiquidCrystal lcd(7, 8, 9, 10, 11, 12); // Define lcd instance

byte NEW_UID[4]; // Create a 4 piece list for the UID to be stored in when reading

Next up we need to talk about how C handles functions.  When you start a program in C++ you get 2 main functions, setup() and loop().  The setup() function runs only once and is obviously used for setup of variables, pinmodes, etc.  And loop() runs infinitely over and over again so you generally use that for anything else unless you want to make a custom function for something, but for this project I didn’t have much of a need for that.  During my setup function I needed to do a few key things, the most important of which were to initialize the serial bus and the LCD library for its resolution.  After that I also defined my pins using pinMode(), pinMode() takes in some pin and sets it up as either input, input_pullup, or output.  For this code I defined READ_PIN and WRITE_PIN as input_pullup, what this means is that there is a resistor running on the line the button is on and if the voltage line gets sent to ground, by the button being pushed, then the resistor line won’t get any voltage and will read as low, when this happens the Arduino knows the button has been pushed.

void setup() {
  Serial.begin(9600);
  SPI.begin();
  lcd.begin(16, 2);
  mfrc522.PCD_Init();  // Init MFRC522 card
  pinMode(READ_PIN, INPUT_PULLUP);
  pinMode(WRITE_PIN, INPUT_PULLUP);
}

Next up we get into the fun part… the loop!  This has 3 parts, the initial precursor stuff, then the read function and the write function.  Properly I should have put them into their own functions, but instead I placed them into if statements because it was easier.  So in the beginning of the loop function I clear the LCD and print “Standby.” on it, then wait until the reader detects a new card in its range.

void loop() {
  lcd.clear();
  lcd.print("Standby");

  // Wait until new card is present
  if ( ! mfrc522.PICC_IsNewCardPresent() || ! mfrc522.PICC_ReadCardSerial() ) {
    delay(50);
    return;
  }

Once this section has run and the Arduino detects a new card it’ll jump into either the read or the write loop depending on which button is pressed.  If the read button is pressed then the LCD will display “READING…” while a for loop grabs the UID from the card and prints it to the display, also placing the UID into the NEW_UID list we created earlier.

// Read function
if (digitalRead(READ_PIN) == LOW) {
  lcd.clear();
  lcd.setCursor(0, 0);
  lcd.print("READING...");
  delay(500);
  lcd.setCursor(0, 1);
  lcd.print("UID:");
  for (byte i = 0; i < mfrc522.uid.size; i++) {
    lcd.print(mfrc522.uid.uidByte[i] < 0x10 ? " 0" : " ");
    lcd.print(mfrc522.uid.uidByte[i], HEX);
    NEW_UID[i] = (mfrc522.uid.uidByte[i]);
  }
  lcd.setCursor(0, 0);
  delay(1000);
}

On the other hand when the write button is pressed the program will take the UID previously stored in NEW_UID and it will write it to the card.  If it succeeds in writing the new UID then it declares “Written!” to the screen and reads the UID to display it on the screen again just as a sanity check.

  //Write function
  if (digitalRead(WRITE_PIN) == LOW) {
    lcd.clear();
    lcd.print("WRITING");
    delay(500);
    lcd.setCursor(0, 0);
    if ( mfrc522.MIFARE_SetUid(NEW_UID, (byte)4, true) ) {
      lcd.print("Written!");
    }
    lcd.setCursor(0, 1);
    for (byte i = 0; i < mfrc522.uid.size; i++) {
      lcd.print(NEW_UID[i], HEX);
    }
    delay(1000);
  }
  lcd.setCursor(0, 0);
}

And bam, we have a functioning RFID Cloner!  By creating this I did learn quite a bit about RFID itself, as well as how to manipulate it.  I hope you enjoyed the quick overview of current RFID tech and my attempt at a cloner.

Thanks for reading and have a wonderful day!
~ Corbin

PJAS and Some Catching Up

Hello world!

So if you’re just here for the technobabble about my PJAS project, skip down a little bit, otherwise I feel it necessary to explain where the heck I’ve been.   I managed to get myself stuck in a rut a few months ago, where I ended up staring at all my unfinished drafts and wondering why I even bother when I can’t finish a post (very bad thinking).  Pulling myself out of this rut was somewhat a revolutionary turn in my evolution towards growth mindset thinking.  To sum up the several sleepless nights, I essentially decided “improvement over time with crappy posts is better than having no consistency at all.”  So expect some weird consistency for a while. This also means I’ll have a few posts pop up on some old projects, but I feel better personally if I complete those posts rather than discard them.

Without further ado, onto the sciencey-things!  So back in February I competed in the regional competition for the Pennsylvania Junior Academy of Science, and won first place.  So then I competed again in May at the states competition, and won first place again!  (Woot woot!) … but what was the project you ask? Fantastic railroading question! I simulated and analyzed the spread of diseases using a set of differential equations.

To start I need to cover some basics of differential equations.  I have not taken a calculus course yet, so take what I say from here with skepticism, but from what I understand the differential equations I use give us the instantaneous slope for a given time on a graph, and this is essentially all you need to know to implement them into Python.  The equations we’ll be using are known as the SIR Model, it’s a model used for modeling disease spread and was proposed by Kermack and McKendrick in 1927.  The SIR Model:

(1)   \begin{align*} \frac{dS}{dt} = -\frac{\beta I S}{N} \end{align*}

(2)   \begin{align*} \frac{dI}{dt} = \frac{\beta I S}{N} - \gamma I \end{align*}

(3)   \begin{align*} \frac{dR}{dt} = \gamma I \end{align*}

The equation has a few key variables, N is the total population, S is susceptible stock, I is infected stock, and R is recovered stock.  Alongside these, we also have \beta and \gamma\beta is the transmission rate for the disease and \gamma is the recovery rate (usually 1 over the general recovery period).  In order to find the transmission rate for the disease, we need to know the recovery rate and the basic reproductive number (R_0).  Now in my research for this project, I couldn’t find much on how they calculate this number, but it seems to be generally available for most diseases online.  From the basic reproduction rate we can calculate our transmission rate using the following formula:

(4)   \begin{align*} R_0 = \frac{\beta}{\gamma} \end{align*}

(5)   \begin{align*} \beta = R_0 \times \gamma \end{align*}

That covers pretty much everything we need to know about the SIR Model, so onto the programming! For this project we’re gonna have to use SciPy, NumPy, and MatPlotLib.  We’ll start off by defining the many variables we’re gonna be using here.

# Total Population
N = 7406000
# Initial infected and recovered stock
I0, R0 = 1, 0
# (R_0)
R = 15
gamma = 1/21
beta = (gamma*R)
# Total susceptible stock
S0 = N - I0 - R0

The example I’m using here is a measles outbreak in Washington state, as it’s the same example I used when I competed at the state competition.  Next we create a vector of the initial conditions, we need to do this to pass it by SciPy’s Odeint function later in order to solve the differential equations.  We also create a time grid using numpy, this is to represent the total time simulated and be used in our final graphing task.

t = np.linspace(0, 160)
y0 = S0, I0, R0

Now we just need one final piece, the actual equations.  In order to pass them through SciPy it’s easiest if we have them inside their own function.  We just implement them as normal equations using the standard operators.

def SIR(y, t, N, beta, gamma):
    S, I, R = y
    dSdt = -beta * S * I / N
    dIdt = beta * S * I / N - gamma * I
    dRdt = gamma * I
    return dSdt, dIdt, dRdt

After this we can integrate our model over our previously created time grid.  We do this using Odeint, which is one of SciPy’s integrate functions.  I’m not quite sure of the specifics of how this works because I haven’t taken calculus, but essentially it solves our equations for what we need.  First we initialize ret as an object of Odeint, then we run method T on it which solves it for what we need for our S, I, and R variables.

ret = odeint(SIR, y0, t, args=(N, beta, gamma))
S, I, R = ret.T

Now that we’ve solved our equation we just need to graph out our data using MatPlotLib.

fig = plt.figure()
ax = fig.add_subplot(111, axisbelow=True)
ax.plot(t, S, 'r', label='Susceptible')
ax.plot(t, I, 'g', label='Infected')
ax.plot(t, R, 'b', label='Recovered')
ax.set_xlabel('Time (Days)')
ax.set_ylabel('Number of People (1,000,000s)')
ax.set_ylim(0,10000000)
legend = ax.legend()
legend.get_frame()
plt.show()

And finally, when we run our code we get nice graphs such as this:

MatPlotLib graph for PJAS 2019 Measles example

It works! But as with all things, there are some problems.  The first is that the SIR Model I chose to use lacks something called vital dynamics.  Put simply vital dynamics are natural birth and death rates.  The second is that it doesn’t take into account many factors such as autoimmune diseases, dietary differences, and so many other things that can vary the data.  And third, any value we use for our recovery period or transmission rate will always be an average or a general number because diseases and humans are all different.

Overall this was one heck of a project, it was great fun to research into, and winning first place was a great bonus.  My slides from the competition are attached on the new “Slides” page on the site.  I’m working on many more projects this summer including some research with a college professor, so come back for that!

Thanks for reading and have a wonderful day!
~ Corbin

Vowel Shifter

Hello all!

This week we have another practice problem for the Bloomsburg Competition coming up.  This problem is a vowel shifter and the description goes as follows:

Write a program that prompts the user for a sentence and modifies it by shifting each vowel like this:
• a→ e
• e→ i
• i→ o
• o→ u
• u→ a
In other words, each “a” in the original sentence becomes an “e”, each “e” in the original sentence becomes an “i”, and so on, and similarly for capital letters.

We’ll start this program off by creating two lists for each of our vowel sets. These will be called vowelsupper and vowelslower.

vowels = ["a", "e", "i", "o", "u", "a"]
vowelsupper = ["A", "E", "I", "O", "U", "A"]

Next we need to grab our input from the user using phrase = str(raw_input("Enter a sentence.\n")) (Sidenote: The \n at the end of the sentence is an escape operator that just starts a new line.).  Next we need to create a way to iterate through our users input to find and replace vowels with our new shifted vowels.  We do this using a for loop.  A for loop is just a loop that repeats a set number of times and often is used to create a changing variable for the program. Inside this loop we want to use a conditional statement to check if each letter in the phrase is a vowel, and if it is a vowel we want to check if it is upper or lower case. After doing this we will shift the vowel and add the new vowel to our shifted phrase. Then we just repeat this process until we have iterated through the entire original string.

for i in range(len(phrase)):
    if phrase[i] in vowelslower or phrase[i] in vowelsupper:
        if phrase[i].islower():
            shift += vowelslower[vowelslower.index(phrase[i])+1]
        else:
            shift += vowelsupper[vowelsupper.index(phrase[i])+1]
    else:
        shift += phrase[i]

Now we have all the main components needed to create our program.  After combining them all together our final code will look like this:

vowelslower = ["a", "e", "i", "o", "u", "a"]
vowelsupper = ["A", "E", "I", "O", "U", "A"]
shift = ""
phrase = str(raw_input("Enter a sentence.\n"))
for i in range(len(phrase)):
    if phrase[i] in vowelslower or phrase[i] in vowelsupper:
        if phrase[i].islower():
            shift += vowelslower[vowelslower.index(phrase[i])+1]
        else:
            shift += vowelsupper[vowelsupper.index(phrase[i])+1]
    else:
        shift += phrase[i]
print(shift)

And now we have a working solution for Problem #2!  This solution is posted on my GitHub as well.

Thanks for reading and have a wonderful day!
~ Corbin

Okapi and Preparing for the Bloomsburg Competition

Hello all!

I’ve been on a bit of a ‘hiatus’ lately, I’ve been busy with life things and haven’t had a chance to work on any posts here.  But a quick update, I won first place at regionals for the Pennsylvania Junior Academy of Science so I’m going to states in May and I’ll be making a post on that project soon.  I’ve also been preparing the programming club at my school for an upcoming competition at Bloomsburg University where we will be competing.  Because of this we have been doing practice problems and so I will be posting and explaining my solutions to them here.

Our first practice problem is called Okapi.  The problem description goes as follows:

The game of Okapi is played by rolling three dice. A payout in dollars is determined by the rolled numbers according to the following rule:

  • If the three numbers are the same, the player wins the sum of those three numbers.
  • If only two of the numbers are the same, the player wins the sum of the two equal numbers.
  • For three different numbers, the player wins nothing.

Write a program that prompts the user for three dice rolls and outputs the payout.

We need to begin this problem by taking user input using rolls = input("Enter dice rolls: ") which prompts the user for input and sets rolls equal to their input. Next we need to parse out their answer into three separate rolls, this is rather easy and just a matter of indexing the user input. In order to do this we just need to create variables for each roll and then set them to the correct index of rolls using the following code: roll_one, roll_two, roll_three = int(rolls[0]), int(rolls[1]), int(rolls[2]). Now that we have our rolls assigned we just need to use a bunch of conditional statements to determine the output.  Our final code will look like this:

def okapi():
    rolls = input("Enter dice rolls: ")
    roll_one, roll_two, roll_three = int(rolls[0]), int(rolls[1]), int(rolls[2])
    if roll_one == roll_two and roll_two == roll_three:
        print("The payout is $", roll_one*3, ".")
    elif roll_one == roll_two:
        print("The payout is $", roll_one+roll_two, ".")
    elif roll_two == roll_three:
        print("The payout is $", roll_two+roll_three, ".")
    elif roll_one == roll_three:
        print("The payout is $", roll_one+roll_three, ".")
    else:
        print("The payout is $0.")

And now we have a working solution to problem #1!  Another solution can be found on my GitHub, it’s the same premise but just less readable.  I’ll most likely be posting around weekly again soon.

Thanks for reading and have a wonderful day!
~ Corbin

More 3D Printing and Fine Tuning

Hello all!

Lately, I’ve been working with my 3D Printer and I want to talk about some of the things I’ve been doing to get better prints from it.  In my previous post, I forgot to say what 3D Printer I actually have and if I’ve made any modifications to it.  I currently have the Monoprice Maker Select V2 printer.  I only have a singular mod on my printer, and that is a custom filament holder, so there is little to no effect on print quality by this mod.

My venture with trying to fine-tune my printer began when I purchased some new filament, specifically the Hatchbox Blue PLA.  This filament was a great choice because it is a very high-quality filament despite being only around $20 USD.  Before purchasing this I had been printing with the Monoprice Transparent PLA, but that filament had several issues where layers would poorly adhere to each other and it wouldn’t attach to the bed properly.  I’m unsure of why but the new filament has completely fixed this, my layers are now flawless except for some wobble from the printer moving fast.  I also haven’t had to use blue tape or glue on my bed at all since using this new filament.

After getting the new filament I felt a surge of adventure to experiment more with my slicer settings and try to make my prints even better.  For those who may not know, a slicer is a software that takes a file containing a 3D Object and slices it into layers of certain thickness and outputs this as a G-Code file.  This G-Code file is then loaded on the printer and controls what all of the axes and motors on the printer do.

Onto what I changed and experimented with.  The slicer I use is Cura and it’s made by Ultimaker, it’s a free slicer and in my experience works very well.  This is by no means meant to be a post about how to tune your printer, or how to use a slicer, this is just my experience that I find interesting and hope you do too.  I began my experimentation with changing my printing speeds.  While attempting to do complex prints I would get lots of artifacts and ghosting.  I realized that, if the printer is doing a complex print with many small parts, it’s going to shake a lot because I don’t have it braced and its frame is made out of sheet metal.  So in order to fix this, I turned the print speeds down from 60 mm/s to 35 mm/s, a drastic decrease but it worked very well.

The next major change I made with my slicer settings was to find the best flow rate for my extruder.  The flow rate is the amount of filament that the printer pushes out while printing a layer.  I found through some testing that my printer tends to underextrude filament, meaning it needs to push more.  I found that a good setting for my flow rate is around 110%-115%, but this depends on the print.

The final 2 major changes I made were with my temperature and my wall count.  I changed my printing temperature down to 200^\circC from my previous 210^\circC after I notice that the extruder was melting the filament below it over again and ruining prints.  So the Hatchbox Filament is definitely more susceptible to heat than the Monoprice Filament.  The final change I made was my wall count.  The wall count is quite literally the number of walls the printer makes, and with my 0.4 mm nozzle size I was originally using a wall count of 2 for a thickness of 0.8 mm, but this turned out to be extremely fragile in some cases so I bumped it up to 3 walls (Often referred to as perimeters) meaning I have a thickness of 1.2 mm.  This made my prints very durable compared to before and even made complex prints turn out better.

Overall these changes really upped my print quality, and I’m very happy that I can print complex models now.  The testing took a lot of trial and effort but really paid off in the end.  Learning about all of the different G-Code specifics was also a great experience.  And lastly I’ll leave you with the final fruit of my efforts:

A lattice cube torture test I printed.
A benchy test I printed.

Thanks for reading and have a wonderful day!
~ Corbin

An Introduction to Machine Learning Topics

Hello all!

So after my post last week, I received some feedback saying that I should better explain what the concepts that I was talking about are and why / how we use them. So in this post I’m going to attempt to explain most of the concepts I used in my last post.

To start off I’m just gonna break things down and list out the terms I’ll be defining.  In order to do machine learning you should usually have at least two sets of data, a learning set and a testing set of data.  Machine learning is also usually broken down into two main forms, these are supervised and unsupervised learning.  These then break out into the three common types of machine learning problems.  Underneath supervised learning we have classification and regression problems.  And underneath unsupervised learning we have clustering problems.  There’s a handy infographic I found to represent this:As SciKit Learn puts it “Machine learning is about learning some properties of a data set and then testing those properties against another data set.”  In this way, we can define our two data sets.  Our training set is the dataset we are training the computer to recognize data properties off of, and our testing set is what we are trying to predict or classify based on the properties we found.

Now we can move on to the two main types of machine learning, supervised and unsupervised learning.  Supervised learning is defined as a problem in which we feed the program some data as our training set, and that data has additional characteristics that we keep from it.  We then feed it that hidden data as our testing set, and task it with predicting the characteristics.

Underneath supervised learning, we have classification and regression.  Classification is when we feed the program a set of already labelled data, and use that as our training set.  We then feed the program some unlabelled data, and have it predict what that data is based off of our labelled training set.  In my previous post this is what I was doing with handwriting recognition.  Regression is feeding a set of data that has one or more continuous variables to the program, and having it predict the relationship between the variables and the results observed.  This task is a bit weird to envision but I find I can understand it better if I think of an example.  The one that makes the most sense to me is inputting a set of data with three salmon variables, length, age, and weight.  A regression problem using this data would be having the computer predict the length of a salmon based on its age and weight.

Unsupervised learning is defined as a problem in which our training set consists of an infinite amount of input values, but no corresponding target values.  This means our program will be finding common factors in the data reacting based on the absence or presence of them.  A common approach to this is clustering, in which you feed the computer a set of data, and it will separate this data into the common groups of data that share similar characteristics.

I hope this clarifies some of the things from my last post on classification that might be a bit unclear, and feel free to leave a comment if you would like any clarification or I made an error somewhere.

Thanks for reading and have a wonderful day!
~ Corbin


Diving into Machine Learning

Hello all!

So lately I’ve been messing with machine learning because I’ve always been interested in it and it’s just very cool and interesting to me.  I’d like to talk a bit about what I’ve been doing and struggling with and show some examples. I will be working with scikit learn for Python, and it comes with 3 datasets. Iris and Digits are for classification and Boston House Prices are for regression. Simply put classification is identifying something like a handwritten number as the correct number it is and regression is essentially finding a line of best fit for a dataset.  I still have a lot to learn about sklearn and machine learning in general, but I find it really interesting nonetheless and thought you guys would too.

So my code begins with the import of a bunch of libraries.  The only ones I use in my example here are sklearn and matplotlib, the others are simply either dependencies or libraries I plan to use in the future.

import sklearn
from sklearn import datasets
import numpy as np
import pandas as pd
import quandl
import matplotlib.pyplot as plt
from sklearn import svm

In this import, sklearn is the main library I’m using to fit my data and predict things, sklearn.datasets comes with the 3 base datasets Iris Digits and Boston Housing Prices.  I don’t know much about sklearn.svm, but I do know that it is the support vector machine which essentially separates our inputted data and runs our actual machine learning, so when we input testing data it can determine what number we have written. Numpy is a science / math library that adds support for larger multidimensional arrays and matrices. Pandas is a library for data analysis. Quandl is a financial library that lets me pull a lot of data that I can use for linear regression in the future. And matplotlib and it’s sub-library pyplot allow me to output the handwriting data.
So far my code for the recognition looks like this:

clf = svm.SVC(gamma=0.001, C=100)
clf.fit(digits.data[:-1], digits.target[:-1])
clf.predict(digits.data[-1:])
plt.figure(1, figsize=(3, 3))
plt.imshow(digits.images[-1], cmap=plt.cm.gray_r, interpolation='nearest')
plt.show()

Although my understanding is rudimentary, I can explain a little bit of what this does. Clf is our estimator which is the actual machine that is learning, and that is what we pass out training data through with clf.fit().  Clf.fit() lets us pass data into the svm that we made clf off of, and it trains our machine to know what the numbers should look like.  I am passing all digits except for the last one through this function, because we will be testing with the last one.  We then pass a digit through clf using clf.predict(),  which passes data for a know handwritten digit, 8, through clf.  Our object clf then outputs the text <code>array([8])</code> which means that it has predicted our inputted number as 8.  If we print out digits.target[-1:] we can see it and determine if it was correct. We do this using out 3 lines from matplotlib that create the figure, print it, and then show it. The figure we get is this: 

It’s a very low resolution, but it’s an 8! I think that this is brilliant, and I definitely need to learn more about what is happening here with my code. Machine learning is very cool and I definitely need to mess with it more and learn more.  So far I’m learning some of the basic elements like how to fit and predict things, how training and testing sets work, and a lot of the vocabulary that is used when talking about machine learning.  I can now actually talk about things like supervised and unsupervised learning, or classification and regression methods.  Along with this, I’m also learning more about other libraries like matplotlib, and how to write more pythonic (readable) code.  For anyone who wants to try this themselves, there’s a lot of really cool stuff online, but I’m using some of the resources from hangtwenty‘s GitHub repo dive-into-machine-learning.  It can be found here: https://github.com/hangtwenty/dive-into-machine-learning Hopefully by my next post I will have created a basic understanding of linear regression and I can create some cool examples using it, and in my next post I will attempt to give my explanation on how fitting, predicting, and training actually works.

Thanks for reading and have a wonderful day!
~ Corbin